SPECT Molecular imaging Scanners - Software/Hardware
SPECT (Single-photon Emission Computed Tomography) and PET (Positron Emission Tomography) are advanced nuclear medicine imaging techniques that use radiation emitting from the body to create detailed tomographic images.
These methods are often complemented by CT (Computed Tomography), a radiation-based technique. Unlike traditional nuclear medicine imaging, SPECT and PET offer genuine 3D information, enhancing diagnostic capabilities.
View PPM (patient positioning monitor)
TL;DR: My efforts to understand user behavior, advocate for their needs, and secure approval led to the successful integration of this feature into the upcoming SPECT/CT scanner.
While reviewing user research notes from a hospital visit, my colleague and I identified an opportunity to enhance our SPECT/CT scanner system for an upcoming next-gen product.
At that time, technicians used a workaround to view a boom-mounted touchscreen called the PPM (Patient Positioning Monitor) in the scanner room, even though they have better information on their own monitors in the control room.
My team and I proposed implementing UI controls that would display the PPM screen virtually on the control room's monitors in a floating window, allowing patients to use the physical PPM for entertainment or check on their scan's progress.
We advocated for this feature within our Molecular Imaging business line, and after approval, took the discussion across business lines, as our hardware and software integration with CT posed challenges.
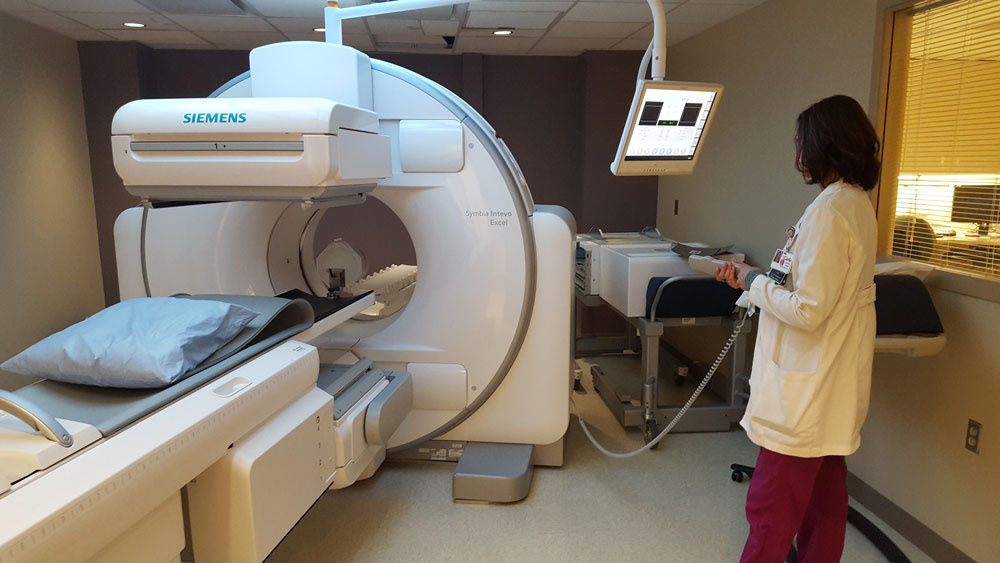
technician positioning scan room elements

sight line from scan room to control room
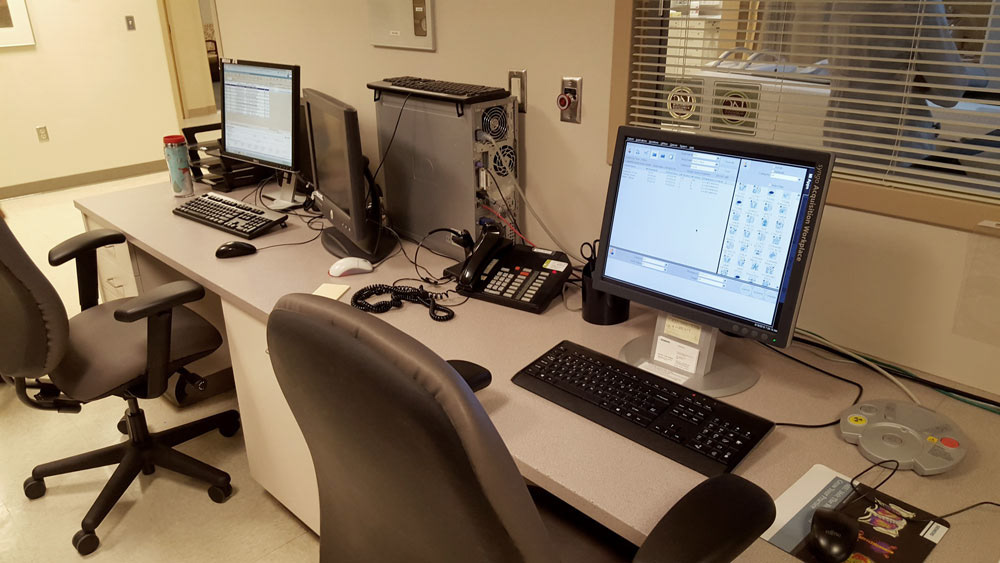
control room perspective
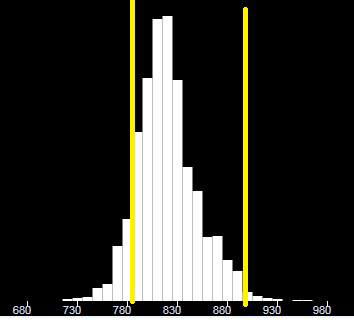
UX Story: Beat Histogram
TL;DR: I researched Beat Histograms, introduced new verbiage and improved the clarity of UI controls, labels and data depiction. This led to reduced scan set up times and improved imaging technician confidence.
While designing elements of a next-gen PET & SPECT scanning platform, I had to research "beat histograms", which are visualizations of heart or breathing rhythms crucial for accurate imaging.
I studied past solutions, technician practices, details around the signal origins, how medical decision-making based on based on histograms actually works, and the impact of user interfaces and physical device settings on this workflow.
Among various decisions, I focused on the user-facing verbiage and labels, including the precise wording for a control to clear cardiac or respiratory data during a scan.
After I'd gained a comprehensive understanding of the histogram's technical aspects, encompassing EKG, limits, and thresholds, my UI recommendations including the label "restart beat histogram" were implemented.

Beat Management
TL;DR: I researched Beat Management, drove the feature forward and improved the clarity of UI controls, labels and data depiction. This reduced scan set up times and improved imaging technician confidence.
"Beat Management" is a process where imaging technicians select specific heartbeats for inclusion or exclusion in a dynamic scan. This enhances image accuracy, allowing reading physicians to swiftly access vital information for effective and safe patient treatment.
"Beat Management" is a process where imaging technicians select specific heartbeats for inclusion or exclusion in a dynamic scan. This enhances image accuracy, allowing reading physicians to swiftly access vital information for effective and safe patient treatment.
Efficient communication of clinical data often hinges on UI design, following careful wording choices and intuitive graphic elements.
Not shown due to IP concerns are the recommendations and subsequent updates to the Beat Management feature.
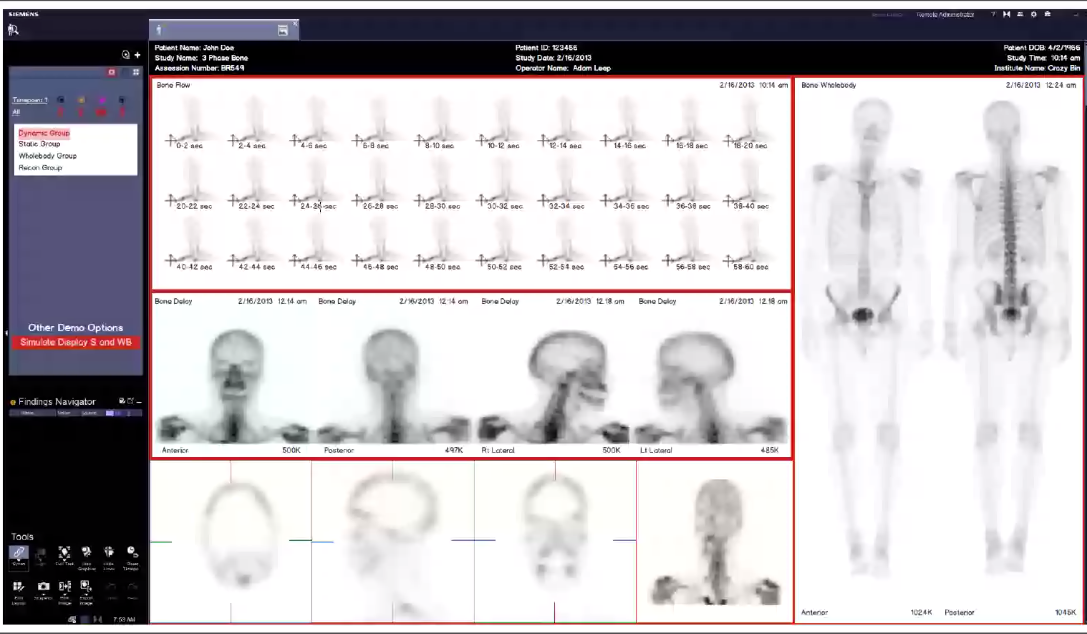
PET Molecular imaging Scanners - Software/Hardware
PET Statistics QC Detector Saturation Images
TL;DR: As the feature owner, I researched intensively drove the feature forward to completion resulting expedited decision-making and improved scan accuracy.
The "PET Statistics" feature offers visual insights into high count rate detection in PET images for technologists and radiologists.
The current system used poorly designed statistics images which caused reading difficulties and equipment maintenance errors, while well-designed statistics images would enable swift identification of high-quality scans, improving PET system performance assessment.
As the feature owner, I represented the feature in product meetings and researched its relevance in the daily tasks of PET imaging techs and medical physicists.
Despite UI constraints, I leveraged previously unused 8-bit color support in the design, enhancing scan readability and expediting decision-making and improved accuracy for users.

Example of the rather dated UI constraints

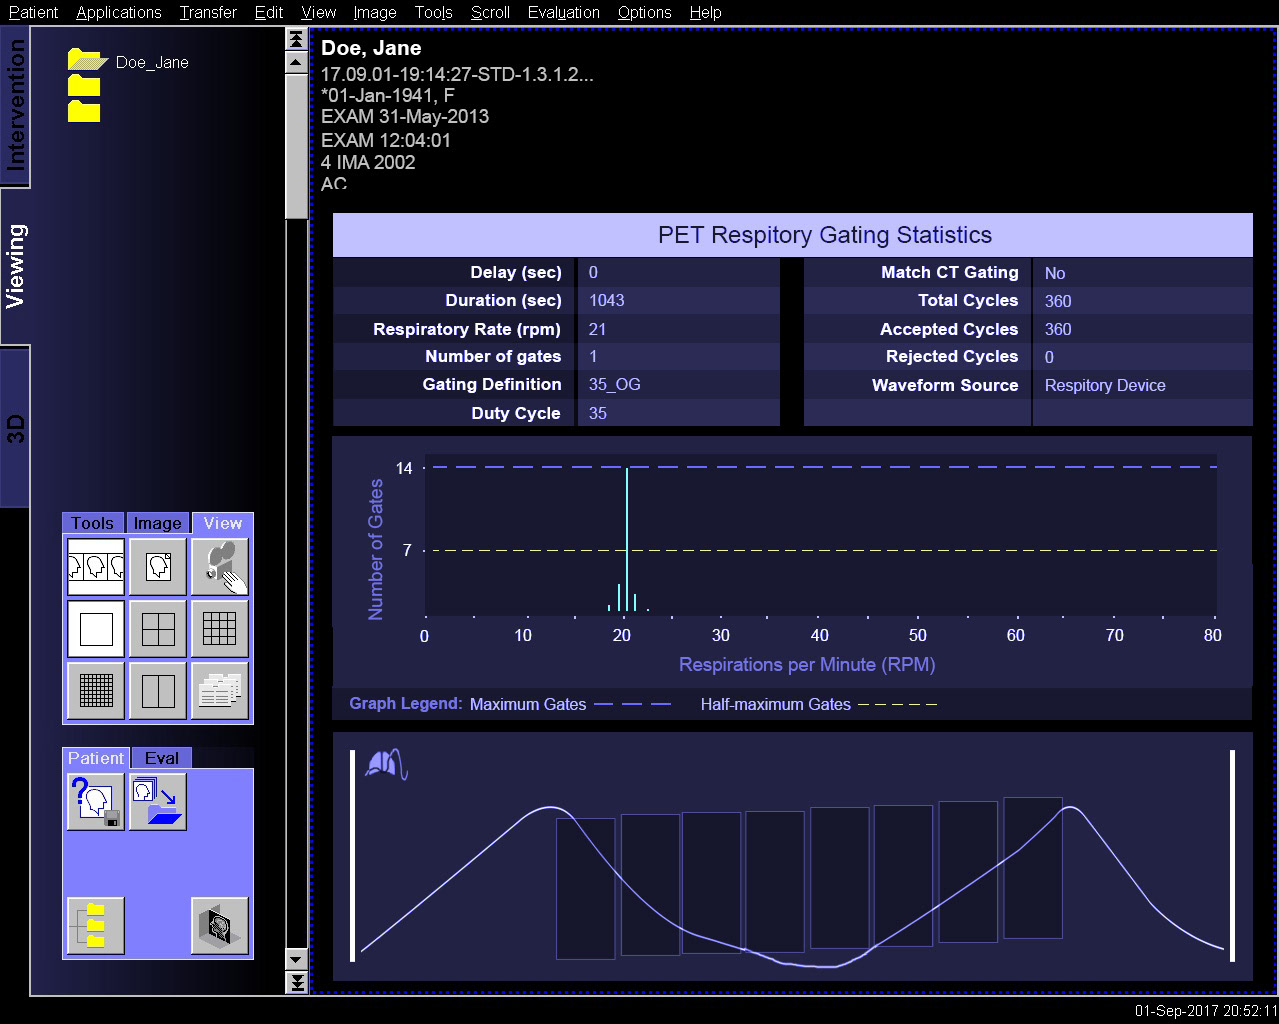
original PET Gating Statistics
redesigned original PET Gating Statistics
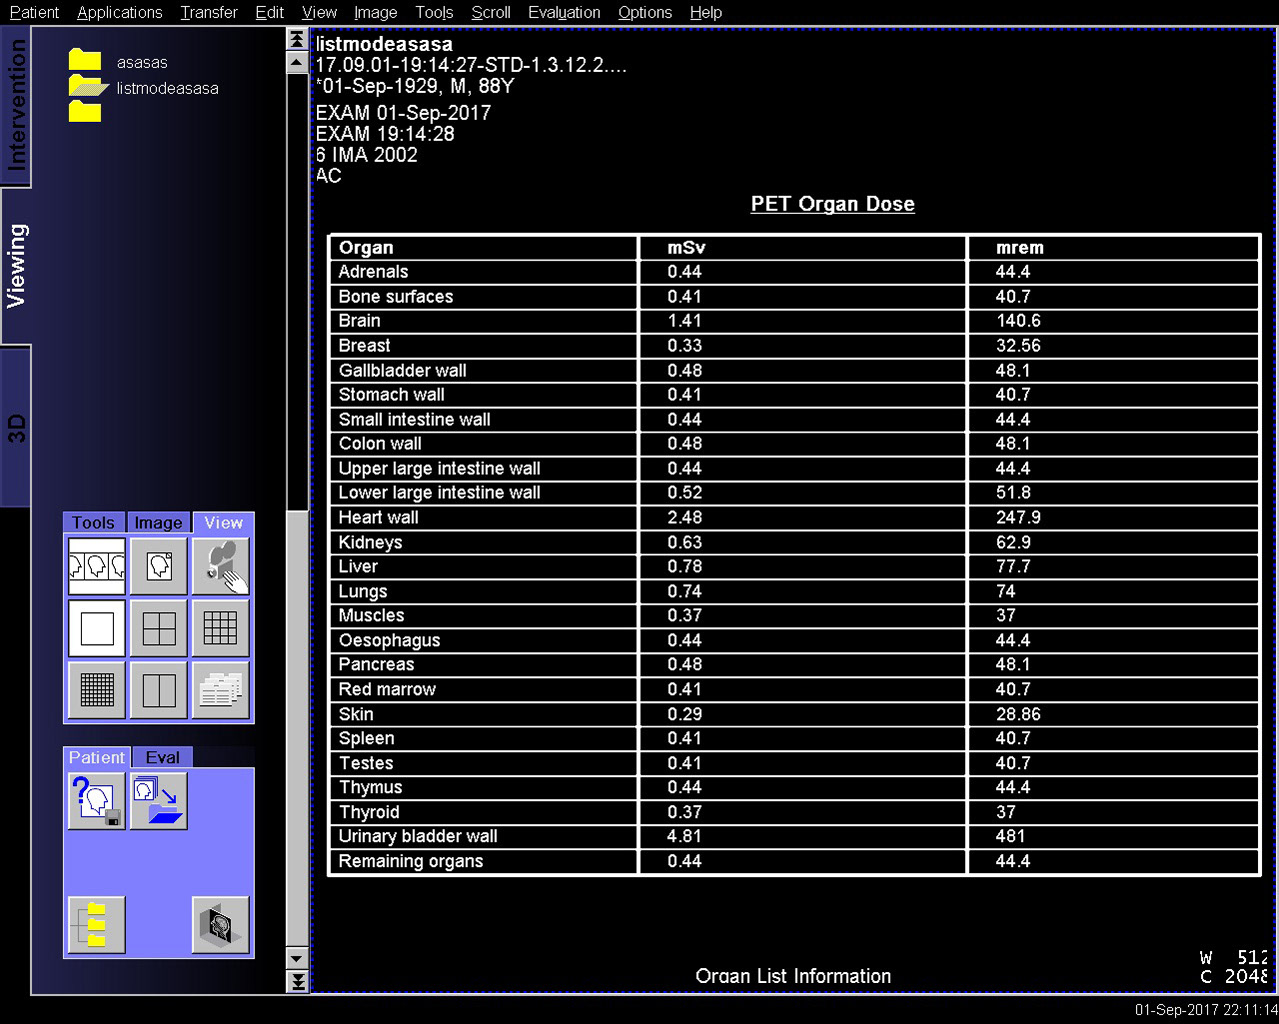
original PET Organ Dose
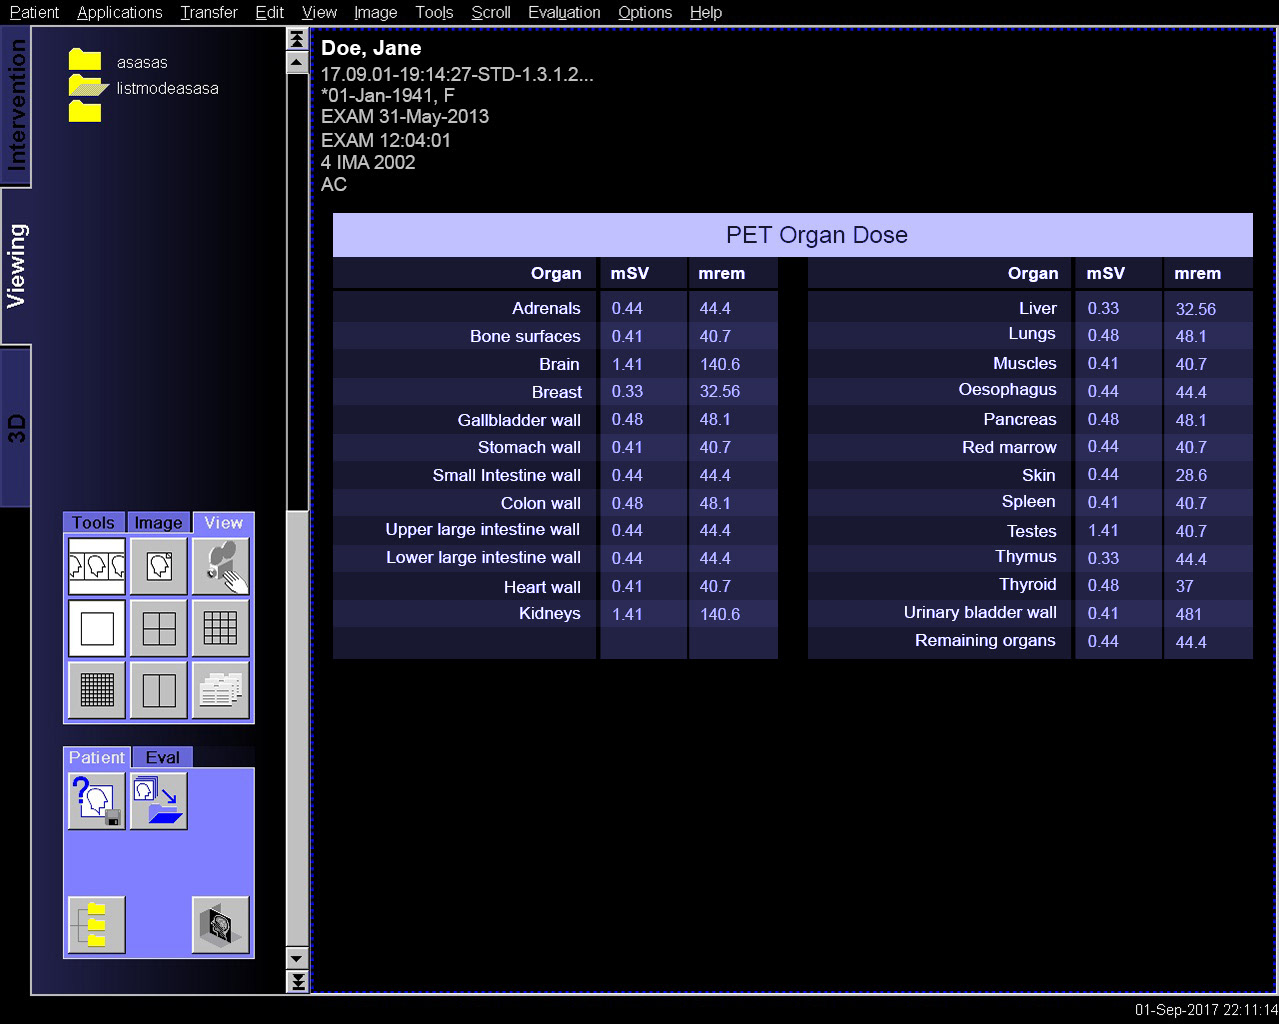
redesigned PET Organ Dose
Molecular Imaging Applications
These apps are used by reading physicians to diagnose and to monitor the progress of prescribed therapies, and include dedicated applications for Neurology, Cardiology, Oncology, and General Reading.
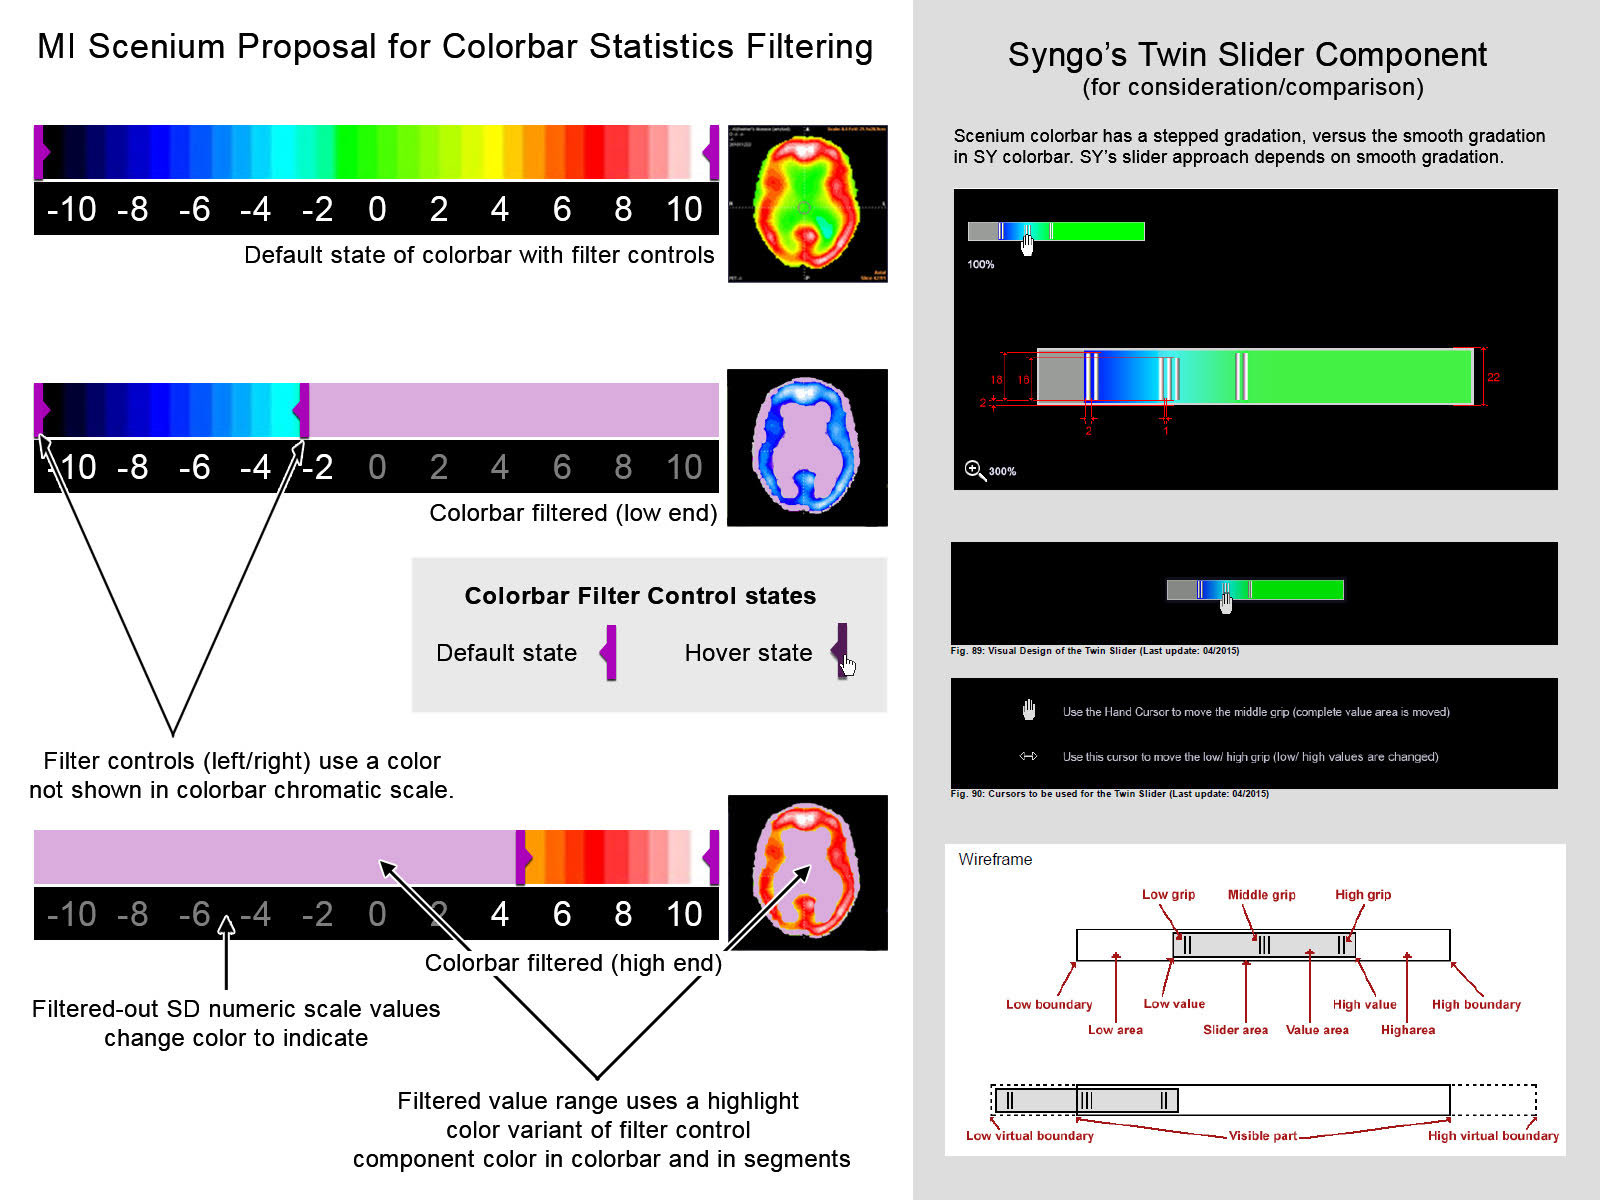
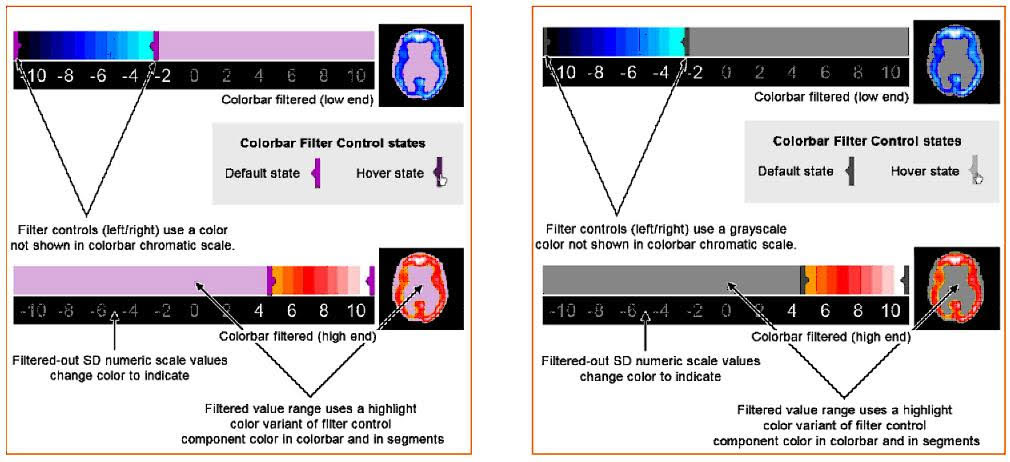
NEUROLOGY "SCENIUM" COLORBAR STATISTICS FILTERING
TL;DR: We built a feature to adjust data visualization on a sliding scale, retaining medically relevant color conventions and enhancing the reading experience and improving confidence for reading physicians.
Scenium is an app for brain scan analysis, enabling users to assess brain conditions. There are tools in Scenium for comparing patient brains to brains in reference databases, to patient's past scans, and left-right halves.
My design for a new slider feature was used to adjust standard deviation filtering, altering brain volume selection in real time. It was crucial to ensure UI adaptability and consistency across environments, and that we adhered to accepted neurology color conventions in the UI.

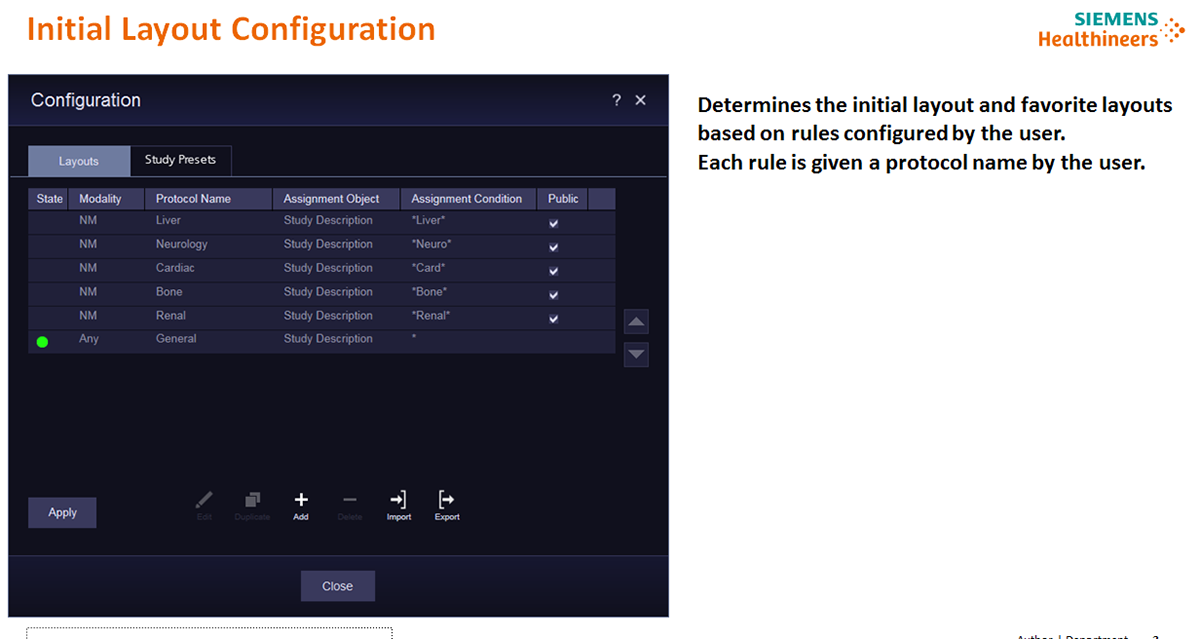
READING - STUDY PRESETS - CONFIGURATION
TL;DR: I designed a feature to address the user story: "As the technologist (physician) I would like to save my own display presets for next read, so I do not need to change certain parameters every time I load a new case efficiency."
"Study Presets" was a long requested way for a user to set up their diagnostic reading system to use specific visualization parameters based on data type (embedded in scan image metadata).
"Study Presets" was a long requested way for a user to set up their diagnostic reading system to use specific visualization parameters based on data type (embedded in scan image metadata).
At the time of this feature project, these parameters were set up by users at the facility, and while the settings were retained, they'd need to be set up again due to system outages, software updates etc.
Newer users often found this setup very challenging based on their level of experience.
Study Presets was designed to mitigate these factors by allowing a user to set up these presets per study type, once - and then have them applied automatically when each study was loaded for viewing.
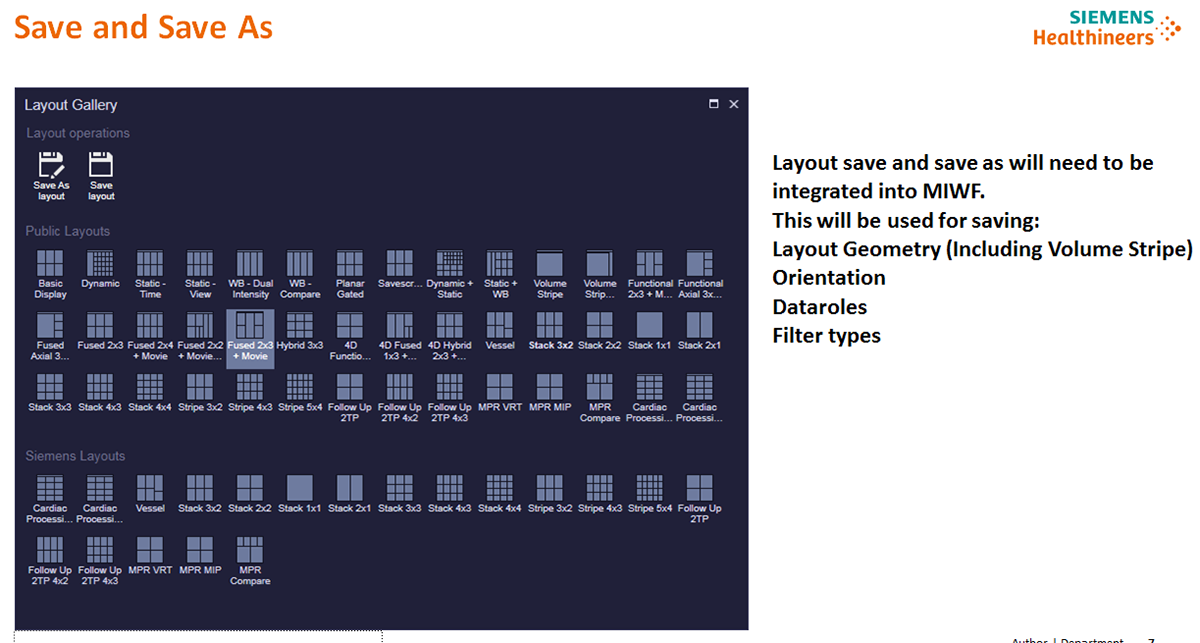

READING - AUTO LAYOUT
TL;DR: I designed a high-impact feature for reading physicians called "Auto Layout", based on support feedback , stakeholder and user interviews and usability testing, driving the feature design from whiteboard sketches to feature release.
In the General Reading app, radiologists and clinicians pre-select optimal scan layouts for efficient and accurate readings, reducing the risk of errors.
Previously, the app offered numerous layout choices, relying on user's memory retention and causing cognitive strain and inefficiency.
The "Autolayout" feature was designed to address this challenge. It automatically analyzes incoming scans, choosing an optimal layout and allowing users to modify selections as needed.
This solution emerged from my interviews, usability tests, and iterative prototyping with clinical users. The feature was scheduled for development and inclusion in an upcoming release.
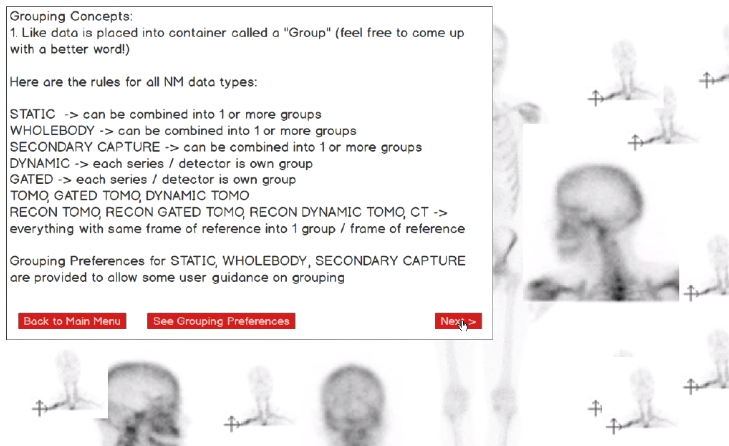
Learning about the concept